Data Science: The Key to Unlocking Business Insights
Understanding Data Science
Data Science is a field that deals with extracting insights and knowledge from data through the use of statistical and computational methods. It involves the collection, processing, and analysis of data to derive insights that can be used to make informed decisions. Data Science is a multidisciplinary field that combines elements of statistics, mathematics, computer science, and domain expertise.
In order to understand Data Science, it is important to understand its workflow. The Data Science workflow consists of the following steps:
- Data Collection: Data is collected from various sources such as databases, APIs, and web scraping.
- Data Preparation: The collected data is cleaned, transformed, and preprocessed to make it suitable for analysis.
- Exploratory Data Analysis: The data is explored to understand its characteristics and relationships between variables.
- Model Building: Statistical and machine learning models are built to analyze the data and derive insights.
- Model Evaluation: The models are evaluated to ensure that they are accurate and reliable.
- Deployment: The models are deployed in production environments to make predictions and inform decision making.
The Data Science field is rapidly evolving, and it is important to keep up with the latest trends and techniques. Some of the key skills required for a career in Data Science include:
- Programming: Proficiency in programming languages such as Python, R, and SQL is essential for Data Science.
- Statistics: A strong foundation in statistics is necessary for understanding and building statistical models.
- Machine Learning: Knowledge of machine learning algorithms and techniques is required for building predictive models.
- Data Visualization: The ability to visualize and communicate data insights effectively is crucial for Data Science.
Overall, Data Science is a complex and multidisciplinary field that requires a combination of technical and domain expertise. With the increasing availability of data and the growing demand for data-driven insights, the importance of Data Science is only set to increase in the coming years.
Data Science Tools
Data Science is a rapidly growing field that requires a variety of tools to analyze, visualize, and interpret data. Here are some of the most popular data science tools used by professionals today.
Python
Python is one of the most popular programming languages used by data scientists. It is an open-source language that is easy to learn and has a large community of developers. Python has a variety of libraries and packages that are specifically designed for data science, such as NumPy, Pandas, and Scikit-learn. These libraries make it easy to manipulate, analyze, and visualize data. Python is also a versatile language that can be used for web development, machine learning, and automation.
R Programming
R is another popular programming language used by data scientists. It is an open-source language that is specifically designed for statistical computing and graphics. R has a variety of packages that are specifically designed for data science, such as ggplot2, dplyr, and tidyr. These packages make it easy to manipulate, analyze, and visualize data. R is also a versatile language that can be used for machine learning, data mining, and statistical analysis.
SQL
SQL (Structured Query Language) is a programming language used to manage and manipulate relational databases. It is an essential tool for data scientists who work with large datasets. SQL is used to extract, transform, and load data into a database. It is also used to query and analyze data. SQL is a powerful language that is widely used in the industry.
Tableau
Tableau is a data visualization tool that is widely used by data scientists. It is a powerful tool that allows users to create interactive dashboards and visualizations. Tableau has a variety of features that make it easy to explore and analyze data, such as drag-and-drop functionality and advanced analytics. Tableau is also a versatile tool that can be used for data storytelling, data blending, and data preparation.
SAS
SAS (Statistical Analysis System) is a software suite used for data management, analytics, and business intelligence. It is a powerful tool that is widely used in the industry. SAS has a variety of modules that are specifically designed for data science, such as SAS/STAT, SAS/ETS, and SAS/IML. These modules make it easy to manipulate, analyze, and visualize data. SAS is also a versatile tool that can be used for machine learning, data mining, and statistical analysis.
In summary, data science tools are essential for analyzing, visualizing, and interpreting data. Python, R Programming, SQL, Tableau, and SAS are some of the most popular tools used by data scientists today. Each tool has its own strengths and weaknesses, and choosing the right tool depends on the specific needs of the project.
Statistics and Probability in Data Science
Statistics and probability are two fundamental concepts in data science that are used to extract insights and make predictions from data. In this section, we will explore the different types of statistics and probability used in data science.
Descriptive Statistics
Descriptive statistics is the branch of statistics that deals with summarizing and describing the characteristics of a dataset. It involves calculating measures such as mean, median, mode, variance, and standard deviation to provide insights into the data. Descriptive statistics is commonly used in data science to gain an initial understanding of the data before performing further analysis.
Inferential Statistics
Inferential statistics is the branch of statistics that deals with making inferences about a population based on a sample of data. It involves using probability theory to estimate population parameters such as mean, variance, and correlation. Inferential statistics is commonly used in data science to make predictions and draw conclusions about a population based on a sample of data.
Bayesian Statistics
Bayesian statistics is a type of statistical inference that involves updating prior beliefs or probabilities based on new evidence or data. It involves using Bayes’ theorem to calculate the probability of a hypothesis given the data. Bayesian statistics is commonly used in data science to make predictions and draw conclusions based on prior knowledge and new evidence.
In conclusion, statistics and probability are essential tools in data science that are used to extract insights and make predictions from data. Descriptive statistics is used to summarize and describe the characteristics of a dataset, while inferential statistics is used to make predictions and draw conclusions about a population based on a sample of data. Bayesian statistics is used to update prior beliefs or probabilities based on new evidence or data.
Machine Learning for Data Science
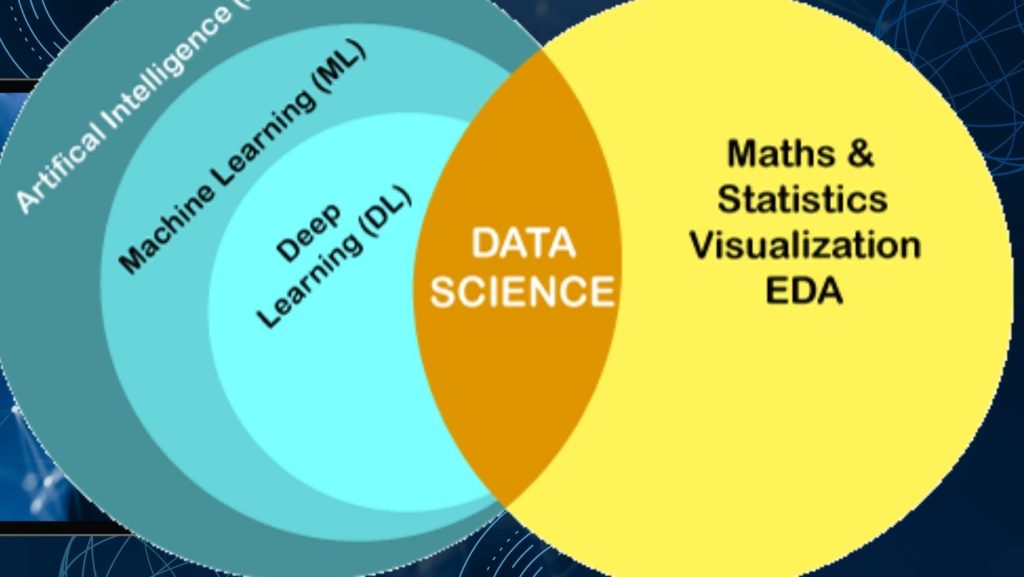
Machine learning is a subset of artificial intelligence that involves the development of algorithms that can learn from and make predictions on data. It is a crucial component of data science, as it allows for the creation of models that can help to identify patterns and make predictions based on data.
Supervised Learning
Supervised learning is a type of machine learning that involves training a model on labeled data. In this type of learning, the algorithm is given a set of input data and the corresponding output data, and it learns to map the input to the output. This type of learning is commonly used in tasks such as classification and regression.
Classification involves predicting a categorical output variable, while regression involves predicting a continuous output variable. Some commonly used algorithms for supervised learning include decision trees, random forests, and support vector machines.
Unsupervised Learning
Unsupervised learning is a type of machine learning that involves training a model on unlabeled data. In this type of learning, the algorithm is given a set of input data and it must identify patterns and relationships within the data on its own. This type of learning is commonly used in tasks such as clustering and dimensionality reduction.
Clustering involves grouping similar data points together, while dimensionality reduction involves reducing the number of variables in a dataset. Some commonly used algorithms for unsupervised learning include k-means clustering, principal component analysis, and hierarchical clustering.
Reinforcement Learning
Reinforcement learning is a type of machine learning that involves training a model to make decisions based on feedback from its environment. In this type of learning, the algorithm is given a set of possible actions and it must learn to choose the actions that will lead to the best outcome.
This type of learning is commonly used in tasks such as game playing and robotics. Some commonly used algorithms for reinforcement learning include Q-learning, policy gradient methods, and actor-critic methods.
Overall, machine learning is a powerful tool for data scientists, allowing them to create models that can make predictions and identify patterns in data. By using different types of machine learning algorithms, data scientists can tackle a wide range of problems and make valuable insights from data.
Data Mining and Data Warehousing
Data mining and data warehousing are two critical components of data science. Data mining is the process of discovering patterns and knowledge from large datasets, while data warehousing is the process of collecting and managing data from various sources to support decision-making processes.
Data Mining
Data mining involves the use of statistical and machine learning techniques to extract insights from large datasets. It is used to identify patterns, relationships, and anomalies in data that can be used to make informed decisions. Data mining can be used in a variety of fields, including finance, healthcare, and marketing.
Some common techniques used in data mining include clustering, classification, and regression analysis. Clustering involves grouping similar data points together, while classification involves predicting the class of a new data point based on previous data. Regression analysis is used to model the relationship between variables.
Data Warehousing
Data warehousing involves the process of collecting, organizing, and managing data from various sources to support decision-making processes. It is used to store historical data, which can be used to identify trends and patterns over time.
Data warehousing involves several stages, including data integration, data cleaning, and data transformation. Data integration involves collecting data from various sources and combining it into a single, unified view. Data cleaning involves identifying and correcting errors in the data, while data transformation involves converting the data into a format that can be easily analyzed.
Data warehousing is used in a variety of fields, including finance, healthcare, and retail. It is used to support decision-making processes by providing decision-makers with access to accurate and timely data.
In conclusion, data mining and data warehousing are two critical components of data science. Data mining is used to extract insights from large datasets, while data warehousing is used to collect and manage data from various sources to support decision-making processes.
Data Visualization
Data visualization is a crucial aspect of data science that involves the creation of graphical representations of data to help in the analysis and interpretation of information. There are numerous data visualization tools available, each with its strengths and weaknesses. In this section, we will explore three popular data visualization tools: Seaborn, Matplotlib, and Plotly.
Seaborn
Seaborn is a Python data visualization library that is built on top of Matplotlib. It is designed to work with Pandas dataframes and provides a high-level interface for creating informative and attractive statistical graphics. Seaborn is particularly useful for creating complex visualizations with minimal code. Some of the key features of Seaborn include:
- Built-in themes for creating aesthetically pleasing visualizations.
- Support for various plot types, including scatter plots, line plots, bar plots, and more.
- Integration with Pandas dataframes for easy data manipulation and analysis.
- Built-in support for statistical estimation and inference.
Matplotlib
Matplotlib is a widely used data visualization library for Python. It provides a comprehensive set of tools for creating a wide range of static, animated, and interactive visualizations. Matplotlib is highly customizable and provides full control over every aspect of a plot. Some of the key features of Matplotlib include:
- Support for a wide range of plot types, including line plots, scatter plots, bar plots, histograms, and more.
- Highly customizable plot elements, including colors, fonts, and labels.
- Support for creating publication-quality figures.
- Integration with other Python libraries, including NumPy and Pandas.
Plotly
Plotly is a web-based data visualization library that allows for the creation of interactive visualizations in Python, R, and JavaScript. It provides a wide range of visualization types, including scatter plots, line plots, bar plots, and more. Plotly is particularly useful for creating interactive visualizations that can be shared online. Some of the key features of Plotly include:
- Interactive visualizations that can be embedded in web pages or shared online.
- Support for a wide range of plot types, including 3D plots and geographic maps.
- Integration with Pandas dataframes for easy data manipulation and analysis.
- Built-in support for statistical estimation and inference.
In conclusion, Seaborn, Matplotlib, and Plotly are all powerful data visualization tools that can be used to create informative and attractive visualizations. The choice of which tool to use will depend on the specific requirements of the project, as well as the user’s familiarity with each tool.
Big Data and Data Science
Data Science and Big Data are two concepts that are often used interchangeably, but they are not the same thing. Big Data refers to the large volume of data that is generated by organizations and businesses. On the other hand, Data Science is the process of analyzing and interpreting this data to extract insights and make informed decisions.
Hadoop
Hadoop is an open-source software framework that is used to store and process large datasets. It is designed to handle Big Data, which is too large to be processed by traditional data processing tools. Hadoop uses a distributed file system to store data across multiple servers, and it can process data in parallel across these servers.
One of the key benefits of Hadoop is its scalability. It can handle petabytes of data, and it can be scaled up or down depending on the needs of the organization. Another benefit of Hadoop is its fault tolerance. If one server fails, the data is still available on other servers, so there is no loss of data.
Spark
Spark is another open-source software framework that is used to process large datasets. It is designed to be faster and more efficient than Hadoop, and it can process data in memory rather than on disk. This makes it ideal for processing real-time data streams.
One of the key benefits of Spark is its speed. It can process data up to 100 times faster than Hadoop, which makes it ideal for organizations that need to process large datasets quickly. Another benefit of Spark is its ease of use. It has a simple and intuitive API, which makes it easy for developers to write applications that process large datasets.
In conclusion, Big Data and Data Science are two related but distinct concepts. Hadoop and Spark are two software frameworks that are used to process large datasets. Hadoop is designed to handle petabytes of data and is fault-tolerant, while Spark is faster and more efficient and can process data in memory.
Data Science in Business
Data Science is a powerful tool that has revolutionized the way businesses operate. It has enabled companies to extract insights from vast amounts of data, which in turn has helped them make informed decisions. In this section, we will explore some of the ways in which Data Science is used in Business.
Business Intelligence
Business Intelligence (BI) refers to the practice of using data to gain insights into business operations. BI tools are used to analyze data and provide reports, dashboards, and visualizations that help businesses make informed decisions. Data Science plays a crucial role in BI by providing the ability to analyze and interpret data in real-time. This allows businesses to quickly identify trends and patterns, which can be used to optimize operations and increase profitability.
Predictive Analytics
Predictive Analytics is the practice of using data, statistical algorithms, and machine learning techniques to identify the likelihood of future outcomes based on historical data. This technique is used in various industries to predict customer behavior, market trends, and operational performance. In business, Predictive Analytics can be used to forecast sales, identify potential risks, and optimize marketing campaigns. By leveraging Data Science, businesses can gain a competitive advantage by making data-driven decisions.
Customer Analytics
Customer Analytics refers to the practice of using data to understand customer behavior and preferences. By analyzing customer data, businesses can gain insights into customer needs and preferences, which can be used to improve customer satisfaction and loyalty. Data Science plays a crucial role in Customer Analytics by providing the ability to analyze large amounts of customer data and identify patterns and trends. This allows businesses to personalize marketing campaigns and improve customer experiences.
In conclusion, Data Science has become an essential tool for businesses to gain insights into their operations, customers, and market trends. By leveraging Data Science techniques such as Business Intelligence, Predictive Analytics, and Customer Analytics, businesses can make informed decisions and gain a competitive advantage.
Data Science Ethics

Data science has become an integral part of modern society, with its models and algorithms impacting various aspects of people’s lives. However, the use of data science raises ethical concerns, as it involves the collection, processing, and analysis of personal data. In this section, we will discuss some of the ethical issues that arise in data science and how they can be addressed.
Privacy and Confidentiality of Data
Data scientists often work with sensitive data, such as personal information, health records, and financial data. Therefore, it is crucial to ensure that the data is handled with the utmost care and respect for individuals’ privacy. Data scientists should follow ethical standards and guidelines to protect data privacy and confidentiality. They should also obtain informed consent from individuals before collecting their data and ensure that the data is anonymized or de-identified to prevent re-identification.
Fairness and Bias
Data science models can be biased, leading to unfair treatment of certain groups of people. For example, a hiring algorithm may discriminate against women or minorities if the data used to train the model is biased towards a particular group. Data scientists should strive to develop fair and unbiased models by using diverse and representative datasets, testing for bias, and regularly monitoring and updating the models to ensure fairness.
Transparency and Accountability
Data science models can be opaque, making it difficult to understand how they work and how they make decisions. This lack of transparency can lead to mistrust and suspicion among individuals and organizations. Data scientists should strive to make their models transparent and explainable by providing clear documentation and explanations of the model’s workings. They should also be accountable for the model’s outcomes and take responsibility for any unintended consequences.
Conclusion
Data science ethics is a complex and evolving field that requires ongoing attention and effort from data scientists and organizations. By following ethical standards and guidelines, data scientists can ensure that their work benefits society while respecting individuals’ rights and privacy.
Frequently Asked Questions
What are the key skills required for a career in Data Science?
A career in Data Science demands a combination of technical and non-technical skills. The technical skills include proficiency in programming languages such as Python, R, and SQL, knowledge of statistical modeling, machine learning, and data visualization tools. The non-technical skills include problem-solving abilities, critical thinking, communication skills, and business acumen.
What is the difference between Data Science and Data Analytics?
Data Science and Data Analytics are often used interchangeably, but they are not the same. Data Analytics is the process of examining and interpreting data using statistical and analytical methods to gain insights and inform decisions. Data Science, on the other hand, involves the entire process of extracting insights from data, including data collection, cleaning, and preparation, as well as the application of statistical and machine learning techniques to build predictive models.
What is the importance of Data Science in today’s industry?
Data Science has become increasingly important in today’s industry due to the exponential growth of data. With the rise of big data, companies need professionals who can extract insights from large datasets to inform business decisions. Data Science is used in various industries, including healthcare, finance, retail, and marketing, to drive innovation and improve efficiency.
What are some popular tools used in Data Science?
There are several popular tools used in Data Science, including programming languages such as Python, R, and SQL, statistical modeling tools like SAS and SPSS, and machine learning libraries such as TensorFlow and Scikit-learn. Data visualization tools such as Tableau and Power BI are also commonly used to communicate insights to stakeholders.
What are some real-world applications of Data Science?
Data Science has numerous real-world applications, including fraud detection in financial transactions, predicting customer behavior in marketing, sentiment analysis in social media, and personalized medicine in healthcare. Data Science is also used in recommendation systems, image and speech recognition, and autonomous vehicles.
What are the ethical considerations in Data Science?
Data Science raises ethical considerations regarding data privacy, bias, and accountability. Data Scientists must ensure that they are using data ethically and transparently, protecting sensitive information, and avoiding discrimination and bias in their models. They must also be accountable for the decisions made based on their models and be prepared to explain and justify their results.


